| auditor | Thursday, June 20, 2024 - 06:12 pm 
This may or may not be intentional by design but I just don't know anymore so figured I should ask a question that I have had for a few years. I'm not asking Andy to disclose any formulas or inner workings of the game, I just would like to know if the math on the Health Index calculation is actually intentional or an error.
With the other main government indexes, their calculations follow a predictable and very simple math path, where Health bucks the trend. All I am asking is if it is intended, I am not calling for changes for the love of god please don't make some radical sudden change in response to this question or take offense to it being asked.
Here is a number by number example of what I am referring to:
Elementary Schools Needed - 35075
Elementary Schools on Hand - 76113
Elementary School Index - 217
Roads Needed - 290344
Roads on Hand - 586495
Roads Index - 202
Finance Income - 1.269T
Finance Cost - 1.071T
Finance Index - 118
Hospitals Needed - 2217
Hospitals on Hand - 5088
Health Index - 196
Everything besides the Health Index is an even on hand / needed, where the hospitals are actually at 2.29x needed but index is flat (very very slightly falling) at 196. |
| James Folsom | Thursday, June 20, 2024 - 11:43 pm
Thanks, auditor it was on my todo list, just not very high.
I suspect it's intentional, and is tied in some way to population age distribution. But, haven't gotten to checking that hypothesis.
It would have been sensible to bake in such a relationship so that if you got a lot old people, you need more healthcare. This something I would have expected to be there from the beginning.
If Andy doesn't respond, I will move it up my list of things to figure out. |
| James Folsom | Saturday, June 22, 2024 - 01:02 am
It's obviously intended. This post is a repeat of the chat, with further calculation example.
After excluding, the outliers that have been losing or gaining hospitals at regular pace (eg, those where the health index is lagging due to moving average calculation)

As you can see (Have/Need) = (Health index) until 125 (regression says), Then above 125 it requires increasingly more hospitals to raise the index a defined amount.
I took a regression of the straight part of the line, and then transformed it to get the equation for calculating the required (have/need) to achieve a desired health index. Its complicated, and I'm not going to try to describe it unless someone realllly wants to know.
(have/need*100)=(desired Health index*1.3455)-43.38
Using Auditor's provided example, where 196 is the desired health index:
196*1.3455-43.38=220.3
It's off by ~9 for auditors example. I tried incorporating the given example into the regression, but it broke it. So either the example given isn't in steady state, or there may be some minor factor unaccounted for.
Further study, could say, but I think this answers the question.
-hymy- |
| James Folsom | Saturday, June 22, 2024 - 08:35 pm
After some further input (angry criticism). I went over to LU to diversify my dataset
| Country # | Have | need | Have | Health | Delta | | /Name | | | /Need | Index | | | 1205 | 169 | 188 | 89.89361702 | 90.24 | -0.346382979 | | 3033 | 205 | 224 | 91.51785714 | 91.62 | -0.102142857 | | 2115 | 2807 | 2887 | 97.2289574 | 97.46 | -0.231042605 | | 1554 | 236 | 220 | 107.2727273 | 107.36 | -0.087272727 | | Hymyland | 711 | 580 | 122.5862069 | 122.65 | -0.063793103 | | 472 | 298 | 242 | 123.1404959 | 123.35 | -0.209504132 | | LU701 | 1275 | 973 | 131.0380267 | 129.64 | 1.398026721 | | 500 | 321 | 242 | 132.6446281 | 130.93 | 1.714628099 | | 416 | 325 | 241 | 134.8547718 | 132.34 | 2.514771784 | | LU1019 | 1450 | 1062 | 136.5348399 | 133.8 | 2.734839925 | | 460 | 350 | 242 | 144.6280992 | 139.78 | 4.848099174 | | N Hymyland | 424 | 287 | 147.7351916 | 141.99 | 5.745191638 | | 105 | 2035 | 1330 | 153.0075188 | 145.98 | 7.027518797 | | LU3464 | 6000 | 3752 | 159.9147122 | 150.72 | 9.194712154 | | LU1521 | 2599 | 1414 | 183.8048091 | 168.69 | 15.11480905 | | LU731 | 6283 | 3046 | 206.2705187 | 181.86 | 24.41051871 | | "" | 2860 | 1268 | 225.5520505 | 194.24 | 31.31205047 | | Auditor | 5080 | 2226 | 228.2120395 | 196.2 | 32.01203953 | | LU1746 | 2500 | 990 | 252.5252525 | 210.9 | 41.62525253 | |
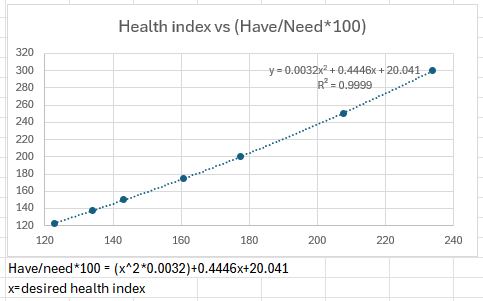
After incorporating more data, it's possible that the relationship is actually a polynomial one. That Rsquare is better than the linear Rsquare.

It's easy to use that formula to make a range of Health indexes with calculated (have/need*100) numbers, plot it, and do another regression to get the needed equation. I don't have the right tools for this, so I'm in excel and I know there are rounding errors that could be avoided with something like MATLAB.
Sadly, the raw data comes from moving averages, because all the indexes in this game are that way. That results in uncertainty that could just look like a polynomial relationship. Use of the equations over time might allow some practical tweaking of the parameters.
The simple linear equation is (have/need/*100)=1.5812x-75.566 where x is the desired health index. The Rsquare is 0.9964
Either equation will not be exact, but will be close to the ball park. The linear one may work better for lower indexes, while the polynomial one may work better for the nosebleed section. |
| James Folsom | Saturday, June 22, 2024 - 08:38 pm
Forum malfunctioned.

 |
| Andy | Monday, June 24, 2024 - 02:16 pm
The health index is not linear.
if you double the number of hospitals, the index will not double.
it is close to linear at low levels, it is getting further from linear as the numbers increase.
as far as I remember, this is true to more than one index at higher levels. |